
Acuity Scheduling Analytics: 4 Ways to Build a Dashboard
TL;DR
- Acuity's built-in reports are free but shallow — revenue and appointment volume only, with no no-show rate, no cancellation analytics, no forecasting, and a revenue report that excludes cancelled and no-show appointments.
- CSV export + spreadsheet costs nothing but your time. The dashboard is stale the moment you export, and you rebuild it every week or month.
- BI connectors (Looker Studio with a Coupler-style sync tool) refresh automatically and bend to any question — but you define every metric, build every chart, and pay a per-connector subscription.
- Tecton Scheduler is the purpose-built option: no-show, cancellation, and revenue KPIs, demand heatmaps, and booking forecasts out of the box, synced from your existing Acuity account in about 15 minutes.
There are four ways to build an analytics dashboard for Acuity Scheduling (formerly Squarespace Scheduling): the built-in reports, a CSV export into Google Sheets or Excel, a BI connector feeding Looker Studio, or a purpose-built dashboard like Tecton Scheduler that ships no-show, cancellation, and forecast KPIs out of the box. Each trades money for effort differently — this guide compares all four honestly.
Below: what each option actually shows you, what it costs in cash and hours, where the data goes stale or quietly wrong, and a straight recommendation for which kind of business should pick which.
Does Acuity Scheduling have a built-in analytics dashboard?
Partially. Acuity ships reports covering revenue and appointment volume, and for a solo operator sanity-checking a month, they're genuinely fine: free, zero setup, always current. But calling them a dashboard is generous, and the gaps are specific:
- The Revenue report excludes cancelled and no-show appointments — the two numbers most owners most want to see — and also excludes appointments you manually marked as paid.
- Totals drift from Stripe or Square whenever refunds happen, which is why so many owners end up reconciling against their payment processor instead of trusting the report. We unpack the exact causes in why your Acuity revenue report doesn't match Stripe or Square.
- There is no no-show-rate report, no cancellation analytics, no forecasting, and no demand heatmap. The built-ins tell you what was booked — not what fell through, when demand peaks, or what next month looks like.
The honest verdict: built-in reports answer “how much did I book?” and little else. For a full walkthrough of what each report does and doesn't show, see our guide to Acuity Scheduling reports.
Every dashboard inherits Acuity's blind spots
If no-shows aren't marked consistently in Acuity, no export, connector, or BI tool downstream can conjure the rate back into existence. Decide how you'll record no-shows before you build anything — here's how to track your no-show rate in Acuity.
How to build a free Acuity dashboard with CSV exports and Google Sheets
The classic free option: pull your appointment data out of Acuity as a CSV, load it into Google Sheets or Excel, and build pivot tables on top. The flow looks like this:
- Export your appointment list from Acuity as a CSV for the date range you care about (the export lives in Acuity's reporting area — check your plan's settings for the exact spot).
- Import the CSV into Google Sheets or Excel.
- Normalize the columns you'll pivot on: service name, calendar or staff member, date, price, and appointment status.
- Build pivot tables for bookings by week, revenue by service, and busiest days.
- Layer charts on the pivots — then repeat the entire export–import–rebuild cycle every week or month.
The strengths are real: it's free, you control every formula, and there's no new vendor to trust. The weaknesses are structural:
- Stale by design. The sheet shows the world as of your last export. A Tuesday cancellation doesn't exist until you re-export on Friday.
- Manual toil that compounds. Fifteen minutes a week sounds harmless; fifteen minutes a week forever, across appointments, payments, and multiple calendars, is a part-time chore that gets skipped the week you're busiest — which is exactly when the data matters.
- Fragile. One renamed column or a re-sorted range breaks formulas silently. That's the worst failure mode for numbers you make staffing and pricing decisions on.
Spreadsheets hide missing data
A pivot table happily averages whatever it's given. If no-shows were never marked in Acuity, your spreadsheet will confidently report a 0% no-show rate — and you'll price and staff as if it were true.
Can you connect Acuity Scheduling to Looker Studio?
Acuity doesn't advertise a first-party Looker Studio connector — third-party connectors fill the gap; check current integrations. The workable pattern is a third-party sync tool (Coupler-style connectors, or a Zapier/Make pipeline) that lands your Acuity data in Google Sheets or a database on a schedule, with Looker Studio, Power BI, or Metabase reading from that destination:
- Pick a connector or automation platform that supports Acuity as a data source.
- Authorize it against your Acuity account and choose what to sync — appointments, clients, payments.
- Land the data in Google Sheets, BigQuery, or another destination on a refresh schedule.
- Define your metrics: what counts as a no-show, how reschedules are treated, which field is “revenue.”
- Design the dashboard itself — every chart, filter, date comparison, and drill-down — in your BI tool.
What you get is auto-refreshing data and unlimited flexibility, including the one thing no other option offers: joining Acuity data with outside sources like ad spend or POS sales. What you take on:
- You are the analyst. The connector moves rows; it doesn't know what a healthy no-show rate is or how this month should compare to last. Every KPI is yours to define, build, and debug.
- Per-connector cost. Sync tools are typically subscription-priced per connector or per data source — commonly tens of dollars a month before you've built a single chart.
- Maintenance is forever. Expired authorizations, schema changes, and silent sync failures all land on you, usually discovered when a number looks wrong in a meeting.
This route earns its keep when you have a data-comfortable person in the business and questions the other options can't touch. For most appointment businesses, it's a lot of infrastructure to answer questions a purpose-built tool answers on day one.
What does a purpose-built Acuity analytics dashboard give you?
Tecton Scheduler takes the opposite approach: instead of handing you raw rows, it layers on top of your existing Acuity account (it doesn't replace it), syncs appointments and services on demand or on a schedule with credentials encrypted at rest, and ships the appointment-business KPI set pre-built:
- Core KPIs with context: revenue booked vs. collected, bookings, average ticket, cancellations, no-shows, and new clients — for today, 7 days, 30 days, and the month, each with prior-period comparisons and sparklines on the analytics overview.
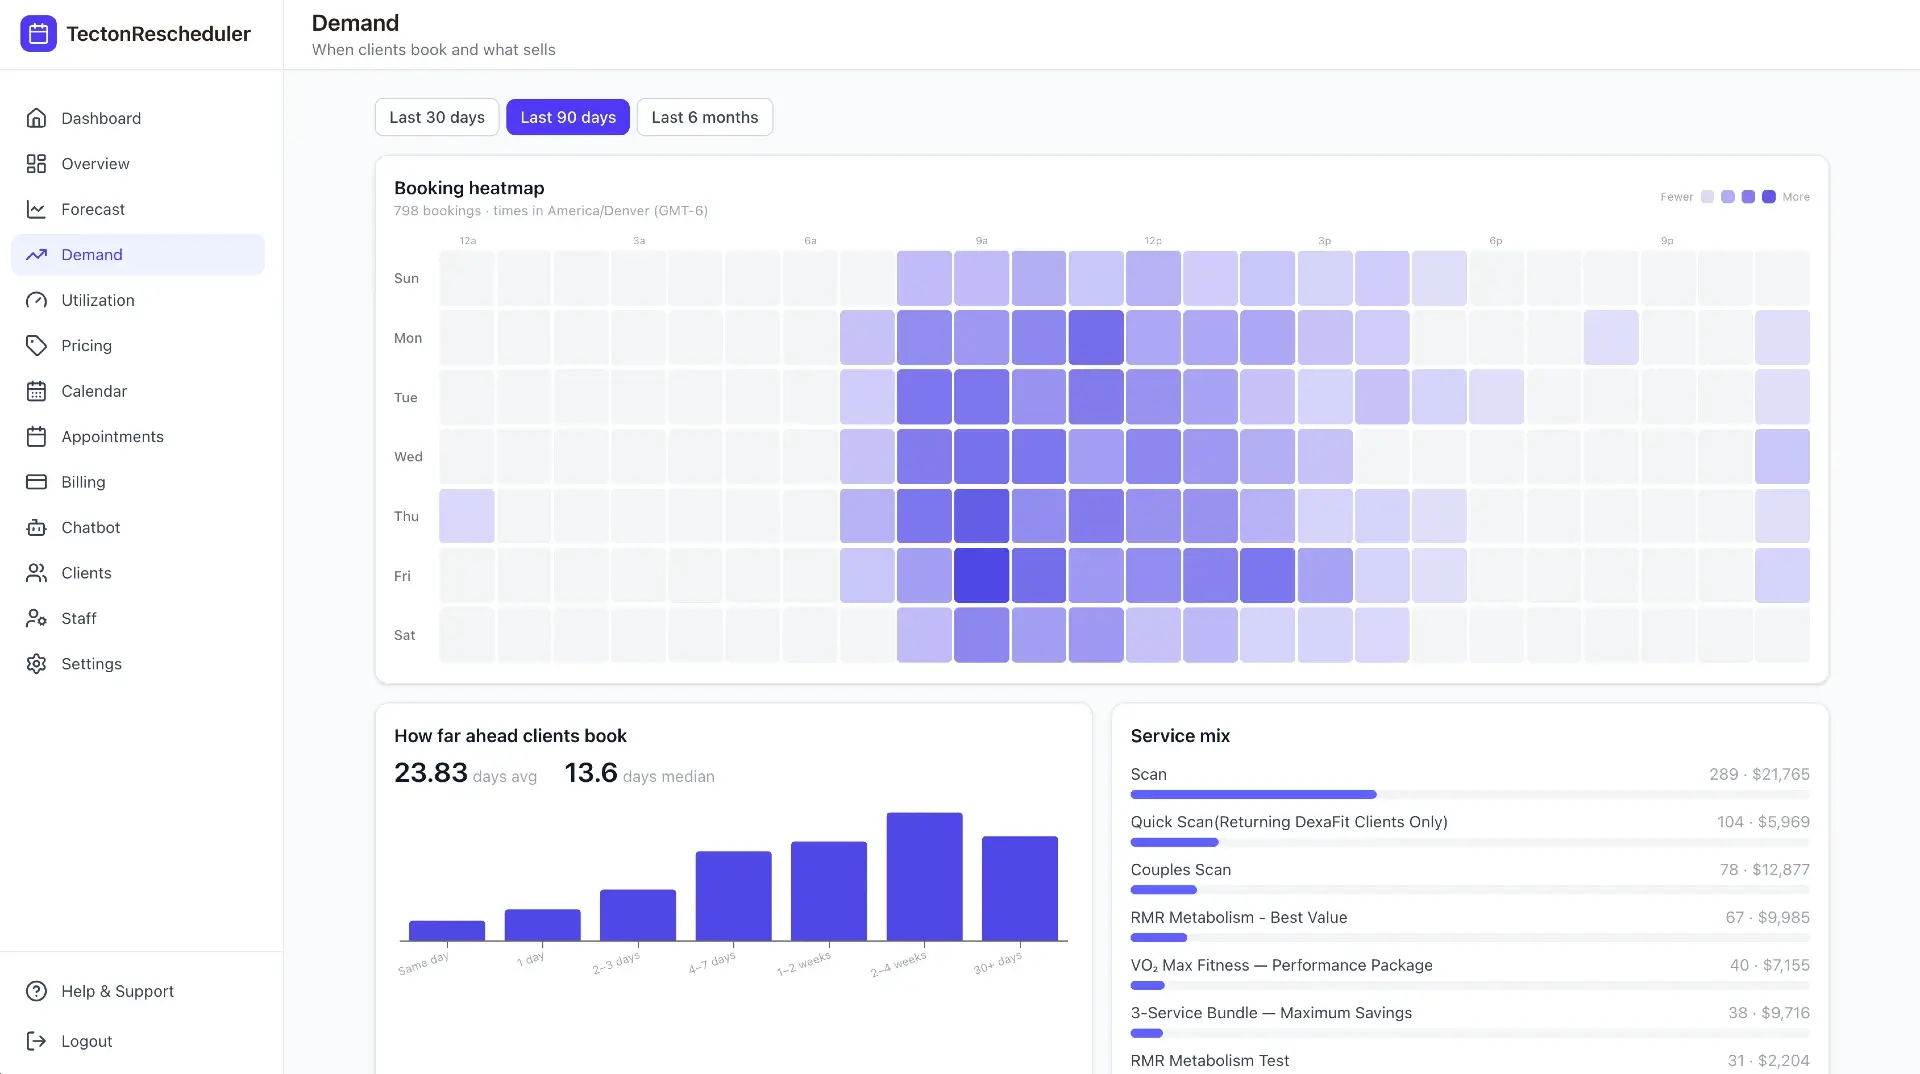
- A demand heatmap by day and hour, plus lead-time distribution and a service-mix ranking — so you can see when clients actually want to book and which services carry the calendar.
- Forecasts of bookings, revenue, cancellations, and no-shows for the next 7, 30, and 90 days, with ranges and your projected busiest and quietest days.
- Promotion impact measured against a matched baseline, with price elasticity per service — so a discount's real effect isn't guesswork.
Setup is the other difference: about 15 minutes, with no metric definitions to write and no connector plumbing to babysit. Plans (Starter, Growth, Scale) are custom-priced to your booking volume, month-to-month, with a free trial on every plan.
More than read-only analytics
Tecton also runs a self-serve client reschedule link with optional fees collected via Square or Stripe, so reschedules, fee charges, and declined cards show up in a read-tracked notifications feed alongside your KPIs. The dashboard and the fix live in one place.
Acuity analytics options compared: cost, effort, and what you get
| Built-in reports | CSV + spreadsheet | BI connector + Looker Studio | Purpose-built (Tecton) | |
|---|---|---|---|---|
| Cash cost | Included with Acuity | Free | Connector subscription, typically tens of $/mo | Subscription, custom to booking volume |
| Setup effort | None | Hours for the first version | Days: pipeline, metric definitions, report design | About 15 minutes |
| Ongoing effort | None | Re-export and rebuild every period | Maintain syncs, auth, and schema changes | None — syncs on demand or on a schedule |
| Data freshness | Current, but narrow | Stale as of last export | Scheduled refresh | On-demand or scheduled sync |
| No-show & cancellation KPIs | No | Only what you build | Only what you define | Out of the box |
| Forecasting | No | No | Build it yourself | 7/30/90-day, with ranges |
| Demand heatmap | No | Manual pivot table | Build it yourself | Built-in, by day and hour |
| Best for | Quick sanity checks | One-off analyses | Data-savvy teams with custom questions | Owners who want answers, not projects |
These options also compose. Plenty of businesses run built-in reports for day-to-day glances, keep a spreadsheet for one annual deep-dive, and adopt a purpose-built dashboard once no-shows and cancellations start costing real money — a threshold most owners underestimate until they put a number on their no-shows.
Which Acuity dashboard option should you pick?
- Just starting out, light booking volume: stay with the built-in reports and reconcile revenue against Stripe or Square monthly. Add a spreadsheet only when a specific question demands one.
- Comfortable in spreadsheets, need answers occasionally: CSV + Google Sheets is perfectly good for a quarterly review. Just don't mistake a quarterly export for a dashboard — it's a snapshot with charts.
- Have an analyst (or are one), and need Acuity blended with other data: the BI-connector route is the flexible power option. Budget honestly for build time and permanent maintenance, not just the connector fee.
- Running a busy calendar and want no-show, cancellation, and forecast KPIs without building anything: a purpose-built dashboard is the shortest path. Tecton's free trial is available on every plan, and the sync runs against the Acuity account you already have.
The first-principles test: a dashboard exists to change decisions — staffing, pricing, policy. If an option can't surface the metric that would change your decision (for most appointment businesses, that's the no-show and cancellation picture), its price doesn't matter, because free-but-blind is still blind.
Put this on autopilot
Tecton Scheduler does this for your Acuity account
Self-serve reschedule links with automatic fees via Square or Stripe, plus revenue, no-show, and demand analytics — synced straight from Acuity Scheduling. Live in about 15 minutes.
Frequently asked questions
Does Acuity Scheduling have a built-in analytics dashboard?
Acuity (formerly Squarespace Scheduling) includes basic reports covering revenue and appointment volume, but no true dashboard: there is no no-show-rate report, no cancellation analytics, no forecasting, and no demand heatmap. The revenue report also excludes cancelled and no-show appointments. For anything beyond booked totals, you need a spreadsheet, a BI connector, or a purpose-built tool.
How do I export Acuity Scheduling data to Google Sheets?
Export your appointments as a CSV from Acuity's reporting area, then import the file into Google Sheets and build pivot tables for bookings, revenue, and busiest days. The catch is freshness: the sheet only reflects your last export, so you repeat the export-import-rebuild cycle every week or month. Third-party sync tools can automate the refresh for a subscription fee.
Can Acuity Scheduling connect to Looker Studio?
Acuity doesn't advertise a first-party Looker Studio connector — third-party connectors fill the gap; check current integrations. The common pattern is a third-party sync tool or automation platform that lands Acuity data in Google Sheets or a database on a schedule, which Looker Studio then reads. It refreshes automatically, but you define every metric and build every chart yourself, and connectors carry their own monthly cost.
Does Acuity Scheduling track no-show rates?
No. Acuity has no no-show-rate report, and its revenue report actually excludes no-show appointments entirely, so the cost of no-shows is invisible in the built-in numbers. Tracking a real no-show rate takes consistent status marking plus an external layer — a spreadsheet you maintain by hand, or a purpose-built dashboard that reports no-shows alongside cancellations and revenue.
Why doesn't my Acuity revenue report match Stripe or Square?
Three known causes: the Acuity revenue report excludes cancelled and no-show appointments, it excludes appointments you manually marked as paid, and refunds processed in Stripe or Square aren't reflected the same way, so totals drift apart over time. Most businesses treat the payment processor as the source of truth and use Acuity's report for booking activity only.
How much does an Acuity analytics dashboard cost?
It ranges from free to a real line item. Built-in reports are included with Acuity; a CSV-plus-spreadsheet dashboard costs only your time; BI connectors typically run a monthly subscription per data source, before build time. Tecton Scheduler is custom-priced to booking volume across Starter, Growth, and Scale plans, month-to-month, with a free trial on every plan.
Keep reading
Acuity Scheduling Reports Explained — and 7 Things They Miss
Acuity Scheduling's built-in reporting covers appointment counts, booked revenue, and CSV export — and misses no-show rates, cancellation analytics, forecasting, demand patterns, and promotion measurement. This pillar guide breaks down all seven gaps and the spreadsheet-versus-dashboard way to fill each one.
Read guideWhy Your Acuity Revenue Report Doesn't Match Stripe or Square
Acuity's revenue report excludes cancelled and no-show appointments, skips anything manually marked paid, and drifts when refunds hit Stripe or Square. This guide breaks down every source of mismatch and gives you a monthly reconciliation routine that actually balances.
Read guideHow to Track Your No-Show Rate in Acuity Scheduling
Acuity Scheduling can mark appointments as no-shows, but it never counts them or calculates a rate. This guide covers the marking discipline, the export-and-spreadsheet method with the exact formula, typical rates by industry, and how to automate tracking.
Read guideWhat No-Shows Actually Cost Your Appointment Business
No-shows per week × average ticket × 52 is the direct annual loss — and it's only the floor. This guide runs the math for a salon, a med spa, and a fitness studio, then covers the three levers that recover the revenue.
Read guide