
Acuity Scheduling Reports Explained — and 7 Things They Miss
TL;DR
- Acuity Scheduling has three reporting surfaces — an appointments report, a revenue report, and CSV export. All are backward-looking counts and totals.
- The revenue report excludes cancelled and no-show appointments and anything manually marked paid, and it can drift from Stripe or Square once refunds happen.
- There is no no-show-rate report, no cancellation analytics, no forecasting, no demand heatmap, and no promotion measurement — the seven gaps covered below.
- Every gap has a spreadsheet workaround built on CSV export, and every workaround has a maintenance cost. Tecton Scheduler layers dashboards for all seven on top of your existing Acuity account.
Acuity Scheduling (formerly Squarespace Scheduling) has three built-in reporting tools: an appointments report for booking volume, a revenue report for money attributed to appointments, and CSV export for raw data. They answer how many appointments you had and what they billed — and stop there. There is no no-show rate, no cancellation analytics, no forecasting, no demand analysis, and no promotion measurement.
Below: what each built-in report actually shows, then the seven gaps that hide real money — and for each, the spreadsheet workaround versus the dashboard that does it automatically.
What reports does Acuity Scheduling actually include?
Acuity's reporting is a record of what got booked and what it was worth. Knowing what each surface measures — and what it leaves out — is the difference between reading your numbers and misreading them.
The appointments report
This is the volume view: appointment counts over a date range, broken down by things like calendar and appointment type. It answers pulse questions — is this month busier than last, which service gets booked most — reliably. What it can't do is separate outcomes: completed visits, cancellations, and no-shows have to be pulled apart before the count tells you anything about money.
The revenue report
The revenue report totals money attributed to appointments in a period. It's the report most owners treat as ground truth, and it's the one with the most fine print: cancelled and no-show appointments are excluded, appointments you manually mark as paid are excluded, and refunds issued in Stripe or Square don't reliably flow back into the totals.
Treat the revenue report as directional, not accounting
Acuity's revenue report is a booked-revenue estimate with exclusions — not a reconciliation-grade statement. If you use it for bookkeeping, you will eventually chase a discrepancy that was designed in, not a bug.
CSV export
Export is the escape hatch. Acuity lets you download appointment data as a CSV, which means any analysis it doesn't do natively, you can build yourself in a spreadsheet. Every gap below has a DIY version that starts with this export — and a point where it collapses under its own maintenance.
The revenue totals that won't reconcile with your processor
The two systems count different things. Your payment processor records money that actually moved; Acuity records appointments and the amounts attached to them, minus several categories it silently drops. That definition gap produces the first two blind spots.
Gap 1: Revenue excludes cancellations, no-shows, and manual payments
Acuity's revenue report leaves out cancelled appointments, no-show appointments, and appointments you manually marked as paid. That costs you both sides of the ledger: money you actually collected — a manually recorded cash payment, a no-show fee charged from the stored card — can be missing from the total, while the revenue you lost to the cancelled Tuesday slot is invisible rather than counted. Nothing tells you what cancellations cost you this month — we break down that math in the real cost of no-shows.
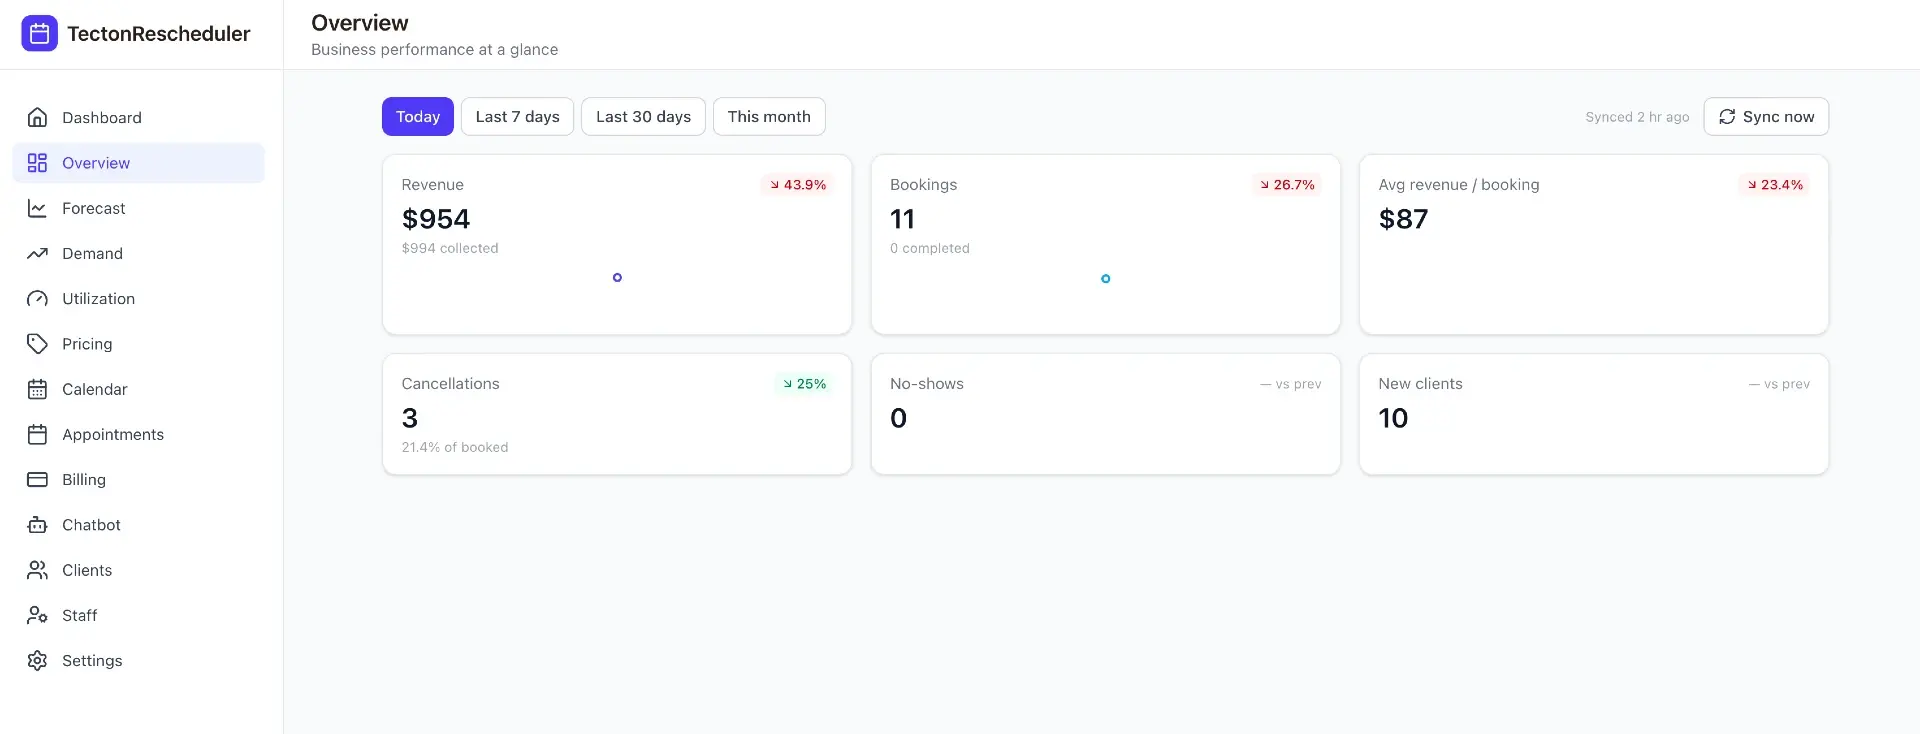
How to get it: export appointments including cancellations, add an outcome column, and pivot revenue by status — or use a dashboard that treats cancellations and no-shows as first-class metrics. Tecton's analytics overview tracks revenue as booked versus collected, alongside cancellations, no-shows, bookings, average ticket, and new clients for today, 7 days, 30 days, and the month, each with prior-period comparisons and sparklines.
Gap 2: Refunds push Acuity and your processor apart
Issue a refund in Stripe or Square and Acuity's revenue total can keep the original figure. One refund is a rounding error; a season of them means your Acuity revenue and your processor payouts diverge by hundreds or thousands, with nobody sure which number is real. If you've already hit this, we wrote a full reconciliation walkthrough in why your Acuity revenue report doesn't match Stripe or Square.
How to get it: the DIY fix is a monthly reconciliation — Acuity export in one tab, processor export in another, match rows and annotate the differences. The layered fix is tracking booked and collected as two separate numbers from the start, which is exactly how Tecton's overview dashboard reports revenue.
No no-show or cancellation reporting
Acuity ships prevention features — cards on file, cancellation policy display, reminder emails and SMS — but no measurement of whether any of it works. These are the two most expensive gaps on the list — no-shows and cancellations are where appointment businesses leak money.
Gap 3: No no-show-rate report
Your no-show rate is the single most actionable KPI in an appointment business. It varies by service, by weekday, and by how far ahead the booking was made — and each variation points at a specific fix: deposits on the worst-offending service, reminders timed to the risky window. Acuity gives you no way to see any of this. You cannot answer “what is my no-show rate?” from any built-in screen.
How to get it: the spreadsheet version is export, tag every appointment's outcome, and divide — with the catch that the result is only as good as your team's discipline in marking no-shows. The dashboard version is automatic: Tecton counts no-shows across the same time windows as revenue, with prior-period comparisons, so the trend is visible without anyone building anything. For the full methodology, see how to track your no-show rate in Acuity.
Gap 4: No cancellation analytics
Cancellations have structure: how far in advance they happen, which services suffer most, whether they cluster on particular days. That structure should drive your policy — the cutoff window, the fee amount, whether to require a card at booking — but Acuity reports none of it, so most policies are set by gut feel. If you're revisiting yours, start with how to charge a cancellation fee in Acuity.
How to get it: DIY means exporting with cancelled appointments included and pivoting on cancellation timing and service — rebuilt by hand every time you want a fresh look. Tecton tracks cancellation counts alongside every other metric, with prior-period deltas, so a bad month announces itself instead of hiding in a CSV.
Can Acuity Scheduling forecast bookings or analyze demand?
No — everything in Acuity's reporting looks backward. There is no forward view of any kind, no pattern analysis of when demand happens, and no way to measure whether a promotion did anything. Those are gaps five through seven.
Gap 5: No forecasting
Staffing, inventory, and cash planning all depend on what next month looks like, and Acuity has no opinion. So slow weeks arrive as surprises. A slow week you see three weeks out is a fixable problem — run a promotion, shift staff hours, open discounted slots. A slow week you discover on Monday morning is just a bad week.
How to get it: trailing averages in a spreadsheet produce a crude forecast that ignores seasonality and trend shifts. Tecton's booking and revenue forecast projects bookings, revenue, cancellations, and no-shows over 7, 30, and 90 days with ranges, and flags your projected busiest and quietest days.
Gap 6: No demand heatmap or lead-time analysis
Which hours are oversubscribed and which are dead? How far in advance do clients actually book? Both questions decide real settings — your operating hours, your reminder timing, your cancellation cutoff — and Acuity can't answer either. If clients typically book nine days out, a 24-hour and a 48-hour cancellation cutoff are very different policies; without lead-time data, you're choosing blind.
How to get it: a weekday-by-hour pivot table from the export works, but it's a static snapshot you rebuild by hand. Tecton's demand heatmap shows booking density by day and hour, plus the lead-time distribution and a service-mix ranking, refreshed from your synced Acuity data.
Gap 7: No promotion measurement
Run a 20%-off week and Acuity shows you the same reports as always. Bookings may rise — but against what baseline? Some of those clients would have booked anyway at full price. Without a controlled comparison, you can't tell a promotion that grew revenue from one that discounted demand you already had.
How to get it: the DIY version is a before/after comparison, which seasonality quietly ruins. Tecton's promotion impact analysis compares the promotion window against a matched baseline and estimates price elasticity per service — so “did the discount actually work?” gets a real answer.
Acuity built-in vs. spreadsheet DIY vs. Tecton: side by side
| Capability | Acuity built-in | Spreadsheet DIY | Tecton Scheduler |
|---|---|---|---|
| Revenue incl. cancellations & no-shows | No — excluded by design | Yes, with disciplined status tagging | Yes — booked vs. collected, tracked separately |
| Agreement with Stripe/Square after refunds | No — totals drift | Monthly manual reconciliation | Booked and collected reported side by side |
| No-show rate | No | Formula on a tagged export | Tracked for today/7d/30d/month with comparisons |
| Cancellation analytics | No | Pivot tables, rebuilt each time | Counts, trends, and prior-period deltas |
| Forecasting | No | Trailing averages at best | 7/30/90-day forecast with ranges |
| Demand heatmap & lead time | No | Static weekday/hour pivot | Heatmap, lead-time distribution, service mix |
| Promotion measurement | No | Before/after guesswork | Matched-baseline impact + price elasticity |
| Ongoing effort | None | Hours per week, forever | Syncs from Acuity on demand or on a schedule |
The spreadsheet column is a legitimate answer for a single calendar and modest volume — plenty of owners run this way for years. What breaks it is growth: more staff means less consistent tagging, more volume means more reconciliation, and the person who built the spreadsheet becomes a single point of failure.
How do you get real analytics on top of Acuity?
You don't replace Acuity — your booking data already lives there. The gap is analysis, not collection. There are two honest paths.
Path 1: Export and build it yourself
- Export your appointments from Acuity as CSV for the period you care about, making sure cancelled appointments are included.
- Standardize an outcome column — completed, cancelled, no-show — and make marking outcomes a daily front-desk habit; the entire system rests on that tagging.
- Build pivot tables for revenue by outcome, no-show rate by service and weekday, and bookings by hour.
- Reconcile the revenue tab against your Stripe or Square export monthly to catch refund drift.
- Re-export and refresh every week — the data goes stale the moment you download it.
Path 2: Layer a dashboard on your Acuity account
Tecton Scheduler connects to your existing Acuity account rather than replacing it, syncs your appointments and services on demand or on a schedule (credentials encrypted at rest), and builds every report in this guide on top: booked-versus-collected revenue, no-show and cancellation tracking, forecasts, the demand heatmap, and promotion analysis. Setup takes about 15 minutes, every plan includes a free trial, and billing is month-to-month. For a full tour of the dashboards, see the Acuity analytics dashboard guide.
Your booking flow doesn't change
Clients keep booking exactly where they book today, and your calendars stay in Acuity. Trying the dashboards is a sync, not a migration — the switching cost is close to zero.
Put this on autopilot
Tecton Scheduler does this for your Acuity account
Self-serve reschedule links with automatic fees via Square or Stripe, plus revenue, no-show, and demand analytics — synced straight from Acuity Scheduling. Live in about 15 minutes.
Frequently asked questions
What reports does Acuity Scheduling have built in?
Acuity Scheduling includes an appointments report for booking volume, a revenue report for money attributed to appointments, and CSV export of raw appointment data. There is no built-in no-show-rate report, cancellation analytics, forecasting, demand heatmap, or promotion measurement — those require exporting to a spreadsheet or layering an analytics tool on top of Acuity.
Why doesn't my Acuity revenue report match Stripe or Square?
Two reasons. Acuity's revenue report excludes cancelled and no-show appointments and appointments manually marked paid, so its scope differs from your processor's. And when you issue refunds through Stripe or Square, Acuity's totals can keep the original amounts — so the two numbers drift further apart with every refund you process.
Does Acuity Scheduling have a no-show report?
No. Acuity offers no-show prevention features — cards on file, cancellation policy display, and reminder emails or SMS — but no report measuring your no-show rate. To track it, you either export appointments and tag outcomes in a spreadsheet, or use a layered analytics tool that computes no-show counts and trends automatically from synced Acuity data.
Can Acuity Scheduling forecast future bookings or revenue?
No, Acuity has no forecasting — its reports are backward-looking counts and totals. You can approximate a forecast with trailing averages in a spreadsheet, or use Tecton Scheduler, which layers on Acuity and forecasts bookings, revenue, cancellations, and no-shows over 7, 30, and 90 days with ranges plus projected busiest and quietest days.
Do I need to replace Acuity Scheduling to get better analytics?
No. Your booking data already lives in Acuity; the gap is analysis, not collection. Tecton Scheduler connects to your existing account, syncs appointments and services on demand or on a schedule, and builds the dashboards on top. Your booking flow, calendars, and client experience stay exactly as they are today.
Keep reading
Why Your Acuity Revenue Report Doesn't Match Stripe or Square
Acuity's revenue report excludes cancelled and no-show appointments, skips anything manually marked paid, and drifts when refunds hit Stripe or Square. This guide breaks down every source of mismatch and gives you a monthly reconciliation routine that actually balances.
Read guideHow to Track Your No-Show Rate in Acuity Scheduling
Acuity Scheduling can mark appointments as no-shows, but it never counts them or calculates a rate. This guide covers the marking discipline, the export-and-spreadsheet method with the exact formula, typical rates by industry, and how to automate tracking.
Read guideAcuity Scheduling Analytics: 4 Ways to Build a Dashboard
Acuity's built-in reports stop at booked revenue and appointment counts. This guide compares the four real ways to get an analytics dashboard — built-in reports, CSV exports, Looker Studio connectors, and a purpose-built tool — by cost, effort, and the KPIs you actually get.
Read guideWhat No-Shows Actually Cost Your Appointment Business
No-shows per week × average ticket × 52 is the direct annual loss — and it's only the floor. This guide runs the math for a salon, a med spa, and a fitness studio, then covers the three levers that recover the revenue.
Read guide